
As the situation in Ukraine evolves, businesses should be mindful of potential risks to their people, assets, operations, or supply chains in the region and globally. Marsh, as part of the Marsh McLennan family of companies, has created a page with information, tools, and resources related to the Russia-Ukraine conflict. Please visit the page for the latest information.

November 14, 2022

Putting pharmacy prices into perspective

Medications shouldn’t break the bank, so why do they?   Specialty medications make up just 2% of pharmacy claims, but account for 50% of overall pharmacy spending. That makes sense when you consider that the current price of a specialty prescription is $3,500 per month! Similarly, gene therapy drugs can range from $250,000 to $2 million a year! That’s a tough pill to swallow.  It’s even more frustrating to know there is little transparency in how these prices are set and minimal opportunity for employers to negotiate these prices. 

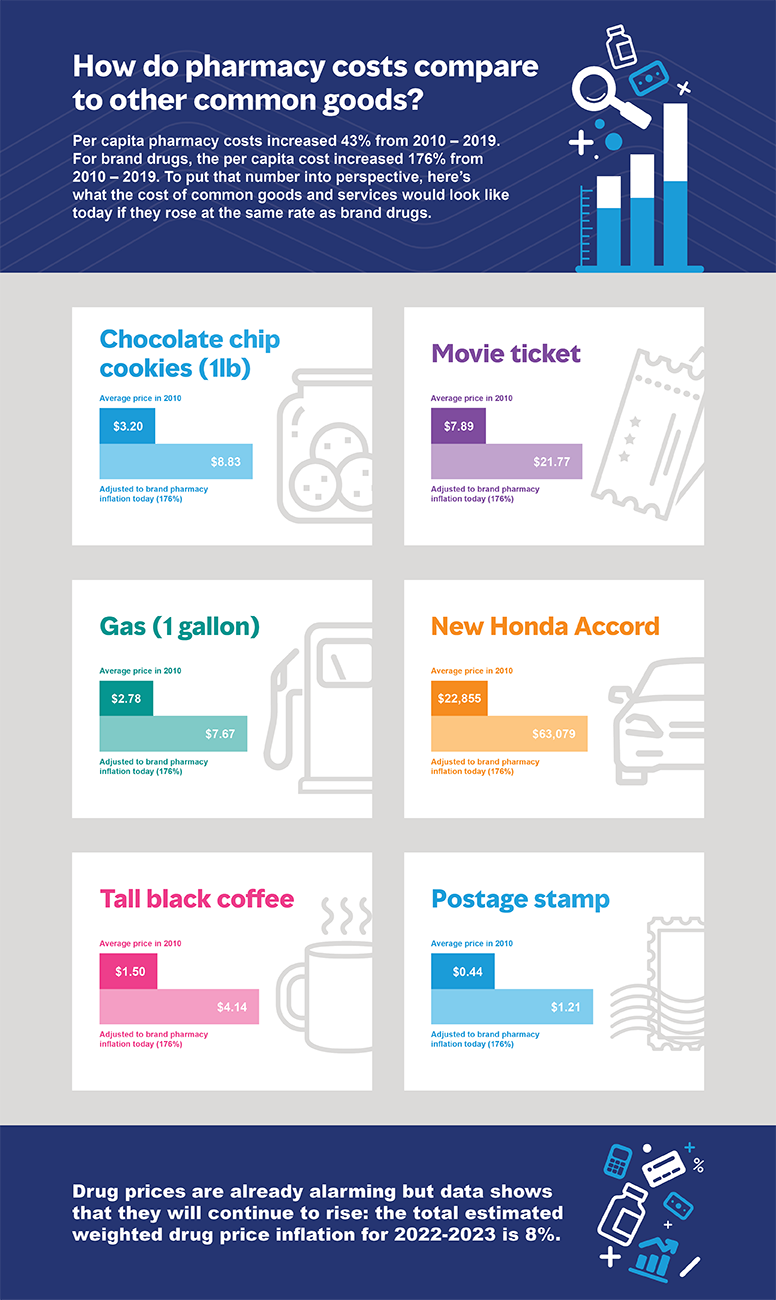
We are no strangers to inflation for goods and services in the current market. People using prescription drugs have been subject to inflation rates for years. According to AHIP the largest part of the healthcare dollar is spent on prescription drugs1.

What drives pharmacy pricing?

The pricing of the pharmacy industry is complex. It boils down to two primary drivers:  unit cost and utilization. Unit cost is simply what each drug costs, and the average cost across all drugs is increasing rapidly for two reasons. First, pharmaceutical manufacturers typically increase the price of existing drugs each year, and second, the drug development pipeline is focused on high-cost specialty drugs, which drives the average cost of new drugs materially higher than they used to be. 

Utilization is typically impacted by the pharmacy plan design and how well it engages employees to become better consumers.  Advertising also plays a role in utilization. Many pharmaceutical companies spend more on advertising than research and development, which leads to increased consumer utilization.2

Optional caption here

Providing quality coverage that is still cost effective is an important objective for organizations. At MMA, we have services and solutions that can help your business navigate the world of pharmacy costs. Learn more here.

Estimate your savings with MMA RxSolutions now.

Infographic Sources

  1. Kaiser—Per capita medical and pharmacy cost by year (2000-2019)

  2. Kaiser—Per capita retail and specialty pharmacy cost by year (2007–2017)

  3. Express Scripts Prescription Price Index (2008–2019)

  4. Bureau of Labor Statistics—CPI by year (2000–2019) 

  5. Estimated Brand and Specialty pharmacy cost change by year (2000–2007)

  6. https://www.singlecare.com/press/prescription-drug-price-increases-january-2022

  7. https://www.consumerreports.org/cro/news/2010/12/best-new-car-deals-for-end-of-the-2010-year/index.htm

  8. https://www.cheatsheet.com/money-career/historical-look-at-the-cost-of-a-cup-of-coffee.html/

  9.  https://www.dollartimes.com/inflation/items/price-of-a-us-stamp-in-2010

Blog sources

  1. Milliman, Where does Your Health Care Dollar Go?, American Health Insurance Plans, Nov 12, 2020  https://www.ahip.org/health-care-dollar/.
  2. https://www.ahip.org/news/articles/new-study-in-the-midst-of-covid-19-crisis-7-out-of-10-big-pharma-companies-spent-more-on-sales-and-marketing-than-r-d